0 reviews
NEWFrom CRISPR to Spatial Omics: Single-Cell Screening and CAR-T Functional Validation to Spatial Omics

Owner
Emma Insight Start-Up India
Category
Research
1. Introduction
Cell and gene therapy is moving from a specialized research area toward an increasingly important component of modern medicine. Cell and gene therapy has emerged as a transformative frontier in modern medicine capable of changing disease treatment and emphasizes CAR-T therapy, CRISPR-based diagnostics and advanced cell-analysis technologies as interconnected parts of this progress. CAR-T therapy has produced durable responses in several hematological malignancies, while extension to solid tumors remains more difficult because of antigen heterogeneity, poor trafficking and infiltration, immunosuppressive tumour microenvironments and functional exhaustion [1,2]. The clinical success of cellular therapy therefore depends not only on engineering cells but also on being able to measure which individual cells are potent, specific and safe.
Recent advances in biotechnology and single-cell technologies offer promising solutions to these challenges, enabling high-throughput analysis while preserving cellular and molecular resolution.Traditional hybridoma, display and bulk assays can be slow, labor-intensive and limited in their ability to preserve single-cell genotype–phenotype information. Droplet microfluidics instead partitions individual cells into picoliter-scale aqueous compartments, allowing secretion, binding and cell-cell interactions to be measured in parallel. The same conceptual strategy can be applied to antibody discovery, cell-line development and functional CAR-T testing. CRISPR diagnostics provide a complementary molecular layer: programmable nucleic-acid recognition enables rapid detection of pathogens or disease-associated sequences, potentially outside centralized laboratories [3,4]. Finally, spatial transcriptomics adds tissue context, allowing computational models to infer biological age and the influence of neighbouring cell populations [5].
2. CRISPR-Based Diagnostics: Principle and Translational Workflow
CRISPR systems were originally characterized as adaptive immune mechanisms in microorganisms. In diagnostics, the same programmable recognition principle is repurposed without using the system to edit a patient’s genome. A guide RNA is designed to recognize a selected nucleic-acid sequence. Once the target is recognized, particular Cas proteins—especially Cas12 and Cas13—can exhibit collateral cleavage activity against reporter nucleic acids. The cleavage separates a reporter signal from its quencher or otherwise generates a measurable fluorescent or lateral-flow signal [3,4]. SHERLOCK uses Cas13-centered RNA detection, whereas DETECTR is commonly associated with Cas12a-based DNA detection. Both can be coupled to isothermal amplification, including recombinase polymerase amplification, to increase analytical sensitivity.
2.1 Conceptual procedure
· Define the clinical or research question and select the nucleic-acid target, such as a pathogen sequence, mutation or cancer-associated biomarker.
· Design and validate a guide RNA that discriminates the intended target from closely related sequences.
· Prepare the sample and, where required, perform nucleic-acid extraction or an appropriate simplified sample-processing step.
· Amplify the target using an isothermal amplification strategy when additional sensitivity is required.
· Combine the amplified target with the CRISPR effector, guide RNA and reporter system.
· Allow target recognition and collateral reporter cleavage to generate a measurable signal.
· Interpret the signal using a predefined threshold or classification algorithm, with positive, negative and process controls.
· Where appropriate, confirm analytical performance against an established reference method such as PCR or sequencing before clinical translation.
CRISPR-based diagnostic technologies have demonstrated applications in the detection of SARS-CoV-2, tuberculosis, malaria, and cancer-associated biomarkers, while emerging developments in portable testing and multiplexed detection are expanding their potential for rapid and accessible diagnostics.This direction is supported by peer-reviewed work showing that CRISPR diagnostics can be adapted for point-of-care applications, although sample preparation, reagent stability, sensitivity, specificity and operational simplicity remain important barriers [3,6]. More recent work has further explored bead-based reporter systems and multiplexed droplet reactions to increase sensitivity and the number of targets detected simultaneously [7]. Thus, the future of CRISPR diagnostics is not simply a faster version of PCR; it is a broader platform in which molecular recognition, isothermal chemistry, miniaturized reaction formats and computational interpretation are integrated.
3. High-Throughput Single-Cell Screening with Picodroplets
One of the most advanced methodological approaches involves single-cell screening using picodroplet microfluidics. The underlying principle relies on encapsulating individual antibody-secreting cells within water-in-oil droplets that function as miniature reaction chambers. This compartmentalization preserves the functional relationship between an individual cell and its secreted antibody, enabling direct identification of rare cells with desired antigen-specific properties. Human plasma blasts obtained following tetanus toxoid vaccination provide an example of this approach. B-cell populations are enriched, followed by isolation of CD38-positive antibody-secreting cells, with murine plasma cells evaluated in parallel as a comparative system. Fluorescent donor and acceptor probes enable detection of immunoglobulin secretion and antigen binding through a fluorescence resonance energy transfer (FRET)-based signal. The encapsulation medium comprises cell culture medium, OptiPrep density-gradient medium, and Pluronic F-68. Following filtration of the cell suspension, individual cells are partitioned into millions of approximately 450-pL water-in-oil droplets using microfluidic droplet-generation technology. The droplets are subsequently incubated to allow antibody secretion and antigen interaction, followed by fluorescence scanning to identify FRET-positive droplets. Selected droplets containing antigen-specific cells can then be retrieved and dispensed individually into 96- or 384-well plates for downstream characterization. The major advantage of this strategy lies in its ultra-high-throughput single-cell screening capacity, enabling analysis of potentially tens of millions of cells per day. Identification of antigen-specific droplets can be followed by recovery of the corresponding cells, antibody-gene amplification and sequencing, thereby establishing a direct link between cellular phenotype, antibody specificity and molecular sequence. This integrated workflow provides a powerful platform for antibody discovery, rare-cell isolation, sequence–function analysis and characterization of candidate therapeutic antibodies.
3.1 Conceptual workflow for antibody-secreting cell discovery
· Obtain and enrich the desired antibody-secreting population from the biological sample.
· Prepare cells in an encapsulation medium compatible with cell viability and the intended fluorescence assay.
· Introduce the cells into a droplet-generation system and partition them into picoliter-scale compartments.
· Include the appropriate antigen and fluorescent detection components so that secretion and antigen binding produce a distinguishable signal.
· Incubate the droplets sufficiently for secretion and signal development.
· Image or interrogate droplets and apply predefined fluorescence gates to identify candidate positive events.
· Sort and dispense selected droplets or cells into microtiter wells.
· Perform downstream recovery, antibody-gene amplification, sequencing, expression and independent confirmation of specificity.
Independent literature supports this general strategy. Shembekar and colleagues demonstrated single-cell droplet microfluidic screening for antibodies that recognize target cells, showing that rare specific binders can be enriched from heterogeneous populations [8]. Josephides and colleagues subsequently described Cyto-Mine as an integrated system for high-throughput single-cell analysis, sorting, dispensing and monoclonality assurance [9]. These studies establish that droplet microfluidics is not merely a miniaturization technology; it changes the scale and logic of screening by making the individual cell the unit of measurement.
3.2. Functional Validation of CAR-T Cells in Picodroplets
Recent advances picodroplet analysis from secretion and antibody binding to functional cell killing. In this approach, engineered CAR-T cells are co-encapsulated with target cells and a fluorogenic granzyme B substrate. Granzyme B is a useful functional readout because cytotoxic T cells release it during target-cell killing. The assay uses a peptide labelled with a fluorophore and quencher. In the intact substrate, fluorescence is suppressed; when granzyme B cleaves the peptide, the quencher is separated and fluorescence increases. A positive fluorescent signal therefore indicates granzyme B activity associated with productive cytotoxic interaction.
3.3. Granzyme B Detection in Picodroplets
A commercially available Granzyme B assay kit (SensoLyte® Granzyme B Activity Assay Kit, AnaSpec, Fremont, CA) was adapted for use in picodroplets to detect the release of Granzyme B. The assay uses a Granzyme B substrate peptide labelled with a 5-FAM fluorophore and an QXL®-520 fluorophore quencher. In the intact, uncleaved state, the close proximity of the QXL®-520 quencher prevents fluorescence emission from the 5-FAM fluorophore following excitation. In the presence of Granzyme B, the substrate peptide undergoes enzymatic cleavage, separating the fluorophore from the quencher. This separation results in the generation of a detectable fluorescent signal, thereby providing a readout of Granzyme B activity within the picodroplets.
Two populations of picodroplets, each approximately 450 pL in volume, were initially generated using the Pico-Capture® instrument to evaluate the feasibility of the Granzyme B detection assay.One population contained only the fluorogenic Granzyme B substrate peptide and served as a negative control. The second population contained recombinant Granzyme B co-encapsulated with the substrate peptide, allowing assessment of the fluorescence response following enzymatic substrate cleavage.After approximately 2 hours of incubation at 37°C, the picodroplets were examined using bright-field microscopy and green-fluorescence imaging. Picodroplets containing both recombinant Granzyme B and the fluorogenic substrate demonstrated clearly detectable fluorescence. In contrast, droplets containing only the substrate peptide exhibited very low or negligible background fluorescence.These observations demonstrate the feasibility of detecting Granzyme B enzymatic activity within picoliter-volume droplets, supporting the application of picodroplet microfluidics for fluorescence-based functional analysis of cytotoxic cellular responses.
This approach is particularly relevant to precision oncology because conventional bulk killing assays can average the behaviour of heterogeneous cell populations. Single-cell functional analysis can reveal rare highly active cells, inactive cells, or distinct response states. It can therefore support more informative characterization of engineered cellular products and potentially help researchers connect phenotype to genotype in later analyses.
3.3.1. Conceptual procedure
· Prepare engineered CAR-T cells and a defined target-cell population expressing the relevant antigen.
· Prepare the fluorogenic granzyme B substrate and appropriate positive and negative controls.
· Generate droplets that co-encapsulate CAR-T cells, target cells and the reporter substrate.
· Incubate droplets under conditions that permit cell-cell recognition and cytotoxic activity.
· Detect fluorescence generated by granzyme B-mediated substrate cleavage.
· Compare antigen-positive target interactions with non-target controls to distinguish CAR-dependent activity.
· Sort or classify droplets according to predefined functional thresholds.
· Use the resulting functional profile as one component of product characterization rather than as a substitute for comprehensive potency, identity and safety testing.
An example involves prostate-specific membrane antigen (PSMA)-directed chimeric antigen receptor T (CAR-T) cells and PSMA-expressing target cells, with PSMA-negative target cells serving as specificity controls. A custom microfluidic biochip incorporates separate aqueous inlets that maintain the physical separation of CAR-T cells and target cells until droplet formation. This design provides controlled cellular co-localization while minimizing premature cell–cell interactions and nonspecific activation before encapsulation. The resulting workflow combines controlled cellular interaction within picoliter-volume reaction compartments with fluorescence-based functional readout, enabling evaluation of antigen-dependent CAR-T cell activity at high throughput. This is an important experimental-design feature because premature cell interaction could generate uncontrolled activation.
4. Development of a Chimeric Antigen Receptor: CAR-T cell development begins with the selection of a tumour-associated or tumour-specific antigen suitable for therapeutic targeting. In this approach, placental chondroitin sulfate (pCS) represents a promising target because its distinctive low-sulfated pattern has been reported on cancer cells while showing limited distribution in healthy adult tissues. T cells are obtained and prepared for genetic engineering with a chimeric antigen receptor (CAR) construct designed to recognize the selected tumour-associated target. The proposed strategy uses the minimum binding domains of VAR2CSA, a Plasmodium falciparum protein that naturally recognizes the specific pCS modification. The CAR construct is introduced into T cells to redirect their antigen-specific recognition and cytotoxic activity toward pCS-positive cancer cells. Following CAR expression, the engineered T cells undergo phenotypic and functional characterization. Recombinant VAR2CSA can be used in flow-cytometric analysis to identify pCS-positive cancer cells and assess target recognition. CAR-T cells can subsequently be evaluated for antigen-dependent interaction and cytotoxic activity against pCS-positive tumour cells, with appropriate pCS-negative or healthy-cell controls used to assess specificity. As an alternative strategy, phage-display technology can identify antibody sequences recognizing the same pCS epitope. The resulting heavy- and light-chain sequences could support development of a conventional CAR with potentially improved specificity and reduced immunogenicity. The overall objective involves preclinical validation of a pCS-targeted CAR-T platform for application across multiple cancer types.
A patient-centred strategy is proposed for the development and evaluation of chimeric antigen receptor T-cell (CAR-T) therapy for large B-cell lymphoma (LBCL). The workflow begins with the collection of patient-derived T cells before CAR-T manufacturing, followed by characterization of the starting cellular population. CAR-T cells are subsequently generated using a CD19-directed CAR construct, enabling engineered T cells to recognize CD19-positive malignant B cells. The resulting CAR-T products are evaluated for their molecular and cellular characteristics before and following infusion.
A key component of the proposed approach involves reverse fate mapping, which tracks individual CAR-T cell clones over time. Matched single-cell analyses of transcriptomes, surface proteins, and endogenous T-cell receptors are used to identify cellular populations associated with desirable therapeutic characteristics, including expansion, persistence, tumour homing, and clinical response. The study also investigates CAR-T regulatory T cells (Tregs), which may contribute to reduced therapeutic efficacy.
Reverse fate mapping, combined with DNA methylation analysis, will be used to investigate the origin and characteristics of CAR-T Tregs. Comparative analysis of Treg and non-Treg CAR-T populations will help identify mechanisms associated with immune suppression and treatment resistance. These findings may support the development of a potentially Treg-reduced CD19-CAR-T therapeutic strategy. Overall, this approach integrates patient-derived cellular therapy, single-cell sequencing, computational systems biology, epigenetic analysis, and functional characterization to support the development of safer and more effective next-generation CAR-T therapies (Rodrigues et. al. 2025).
5. Multiplexed Single-Cell Isolation and Antibody Discovery
Multiplexing is a strategy for measuring several biological parameters simultaneously. In antibody discovery, this can mean combining a cellular label with IgG secretion and antigen-binding measurements. The next-generation Cyto-Mine Chroma is presented as a multi-laser, multi-detector system capable of sequential gating and multiplexed analysis. The central methodological advantage is the ability to isolate rare cells based on more than one property, for example, high secretion plus specific antigen binding.
Multiplexing increases the amount of information obtained from individual cells but also introduces additional analytical complexity. Cross-reactivity, spectral overlap, background fluorescence, gating errors, and data-management challenges can affect assay performance. Therefore, robust multiplexed workflows require carefully designed controls, appropriate compensation or spectral-unmixing strategies, independent confirmation of sorted cell populations, and clearly defined analytical criteria. Such approaches enable the isolation of rare cells from heterogeneous populations, even when multiple antibody-secreting cell populations are present. Peer-reviewed studies of droplet-based microfluidic platforms further demonstrate the potential of combining high-throughput screening with single-cell resolution, thereby facilitating the identification and characterization of rare cellular populations [8,9].
5. Spatial Omics:
Spatial omics refers to a group of technologies that allow researchers to study cells, genes, proteins, and their interactions while preserving their original location within a tissue. In other words, instead of simply asking “Which cells and genes are present?”, spatial omics also asks “Where are these cells and molecules located, and what cells are they interacting with?”These technologies build on traditional tissue-analysis approaches such as hematoxylin and eosin, or H&E staining, immunohistochemistry, or IHC, and immunofluorescence. These conventional methods provide important information about tissue architecture and the distribution of specific proteins.
Now, Spatial transcriptomics measures gene expression while retaining the spatial position of individual cells or molecular signals. Single-cell spatial transcriptomic platforms such as NanoString CosMx, Genomics Xenium, and Vizgen MERSCOPE use molecular probes to detect predefined gene panels, with some platforms supporting panels containing thousands of genes. Importantly, custom probes can also be designed to detect engineered molecules, including therapeutic constructs such as CARs or T-cell receptors, or TCRs.Spatial proteomics approaches involve the measurement and spatial distribution of proteins directly within tissue, enabling the identification and localization of specific proteins and cellular phenotypes while preserving the tissue architecture. Technologies such as MIBI (Multiplexed Ion Beam Imaging) and CODEX(CO-Detection by indEXing, Rodrigues et. al. 2025) can therefore be used either instead of or alongside spatial transcriptomics. This combination can provide complementary information: transcriptomics tells us about gene-expression programs, whereas proteomics helps determine the actual protein phenotype and cellular state.Spatial omics has already been applied in studies investigating Treg therapy in kidney transplantation. This makes it particularly promising for future Treg clinical trials. Let us Imagine that a patient receives therapeutic Tregs. We have different questions in mind to answer for example: 1). Are the transferred Tregs actually reaching the target tissue? 2). Do they persist within the tissue? 3). What phenotype do they acquire after entering the tissue? 4). Which immune and non-immune cells are surrounding them? 5). Do they form Treg-rich organized lymphoid structures, known as TOLS (Treg-rich Organized Lymphoid Structures.)?Spatial omics can potentially answer these questions directly within the tissue biopsy.For example, spatial transcriptomics could identify regions containing Tregs and determine whether these cells express genes associated with suppressive function, activation, migration, tissue adaptation, or exhaustion. At the same time, spatial proteomics could confirm the corresponding protein phenotype.But spatial omics provides another major advantage: understanding the tissue microenvironment. However, Tregs do not function in isolation. Their therapeutic activity depends on their interaction with effector T cells, B cells, antigen-presenting cells, macrophages, endothelial cells, stromal cells, and other components of the tissue environment.Spatial transcriptomics can therefore help reconstruct cell–cell communication networks and determine which cells are positioned close to Tregs and which signaling pathways may be involved.In conventional single-cell RNA sequencing, the tissue is dissociated into individual cells. This provides excellent molecular information, but the original spatial organization of the tissue is largely lost.Spatial omics preserves that anatomical context.This means that we can determine not only which cells are present, but also where they are located relative to one another. It can also provide more accurate information about the proportions and organization of cells within intact tissue.However, spatial omics also has limitations.First, cell segmentation is not perfect. When individual cells are incorrectly identified or boundaries overlap, separating one cell type from another becomes less precise.Second, molecular spillover can occur, where signals originating from one cell or region are incorrectly attributed to neighboring cells.Third, spatial proteomics can have higher background signal than conventional flow cytometry, which can reduce sensitivity.Finally, spatial transcriptomics can experience higher molecular dropout than conventional single-cell RNA sequencing, meaning that some transcripts present in a cell may not be detected.There is also an important practical consideration: cost. Moreover, Spatial omics can be expensive, particularly when many serial tissue biopsies must be analyzed. One strategy for reducing the cost is to construct tissue microarrays, or TMAs, from serial biopsy specimens. Multiple tissue samples can then be arranged on a single array and analyzed simultaneously.Therefore, the key message is this:Spatial omics adds the missing dimension of location to molecular biology.
6.1. Spatial Transcriptomics and Machine Learning for Biological Aging
A complementary area of research focuses on spatial transcriptomics and computational analysis of cellular aging. Spatially resolved transcriptomic approaches enable age-associated molecular changes to be examined while retaining information about the location and neighbourhood of individual cells. In a large-scale study of mouse brain aging, multiplexed error-robust fluorescence in situ hybridization (MERFISH) was used to measure the expression of 300 genes across brain sections, generating a spatially resolved single-cell atlas containing approximately 4.2 million cells across 20 ages and experimental rejuvenation conditions.
The computational workflow incorporated Cellpose for image-based cell segmentation, followed by transcript assignment and quality-control processing using the Vizgen post-processing tool. Spatial gene-expression data were subsequently processed using SpatialSmooth, a spatial pseudobulking approach that iteratively smooths gene-expression values across neighbouring cells of the same cell type. Squidpy was used to construct spatial-neighbour graphs and determine relationships between neighbouring cells. For machine-learning-based biological age prediction, the researchers standardized gene-expression features and applied Lasso regression with scikit-learn’s LassoCV to develop cell-type-specific spatial aging clocks. These models predicted biological age from spatially preprocessed gene-expression profiles and enabled assessment of age acceleration, representing deviation between predicted and expected biological age. The spatial aging clocks performed strongly across multiple cell types, including rare populations such as T cells, neural stem cells and neuroblasts. The analysis was further extended using graph neural network (GNN) models to investigate how neighbouring cell populations influence cellular aging. Spatial-neighbour relationships were constructed using Squidpy, while computational perturbation experiments were used to examine how replacing or removing particular cell types could alter predicted neighbourhood aging. The study identified increasing T-cell infiltration with age and reported a pro-aging proximity effect of T cells, whereas neural stem cells demonstrated a pro-rejuvenating proximity effect on neighbouring cells. Exercise and partial cellular reprogramming were also evaluated as potential rejuvenating interventions [5].
In addition to the experimental workflow, the study demonstrates the importance of integrating bioinformatics, spatial analysis, and machine-learning approaches for interpreting spatial transcriptomic data. The computational pipeline incorporated Cellpose 1.0.2 for image-based cell segmentation, the Vizgen post-processing tool (VPT) for MERFISH data quality control, Spatial Smooth for spatial gene-expression smoothing, and Squidpy for analysing spatial neighbourhood relationships. For biological age prediction, Python-based scikit-learn was used to develop spatial aging-clock models, while Lasso regression enabled identification of gene-expression features associated with biological aging. Graph neural network (GNN) approaches further supported modelling of cell–cell proximity and potential neighbourhood effects. The overall workflow, implemented within a Python computational environment and supported by the SpatialAgingClock package/GitHub implementation, illustrates how image processing, spatial statistics, machine learning, and network-based analysis can be integrated to investigate cellular aging, tissue organization, and interactions between neighbouring cell populations.
A recent study developed spatial aging clocks using single-cell transcriptomics to investigate cell-type-specific interactions and their effects on brain aging, rejuvenation, and disease. Brain aging significantly increases the risk of neurodegenerative diseases, including Alzheimer’s disease, a progressive disorder associated with memory loss, and dementia, which is characterized by progressive cognitive decline (Figure 5). Previous research has investigated molecular changes in the aging brain at single-cell resolution; however, many studies have lacked sufficient spatial context, particularly at large scale. Without a systematic understanding of spatiotemporal changes, including local cellular neighbourhoods and cell–cell interactions, important biological insights may remain unidentified. High-throughput spatial omics technologies offer considerable potential for improving our understanding of these processes. However, existing approaches may not simultaneously capture spatial and temporal information at single-cell resolution, particularly during advanced stages of aging, when cognitive decline becomes increasingly apparent. This study addresses these limitations through the development of spatial aging clocks, providing a framework for investigating cellular aging alongside spatial organization and cell–cell interactions within the brain.
6.2.1. Conceptual computational workflow
· Collect spatially resolved transcriptomic measurements across biological ages or experimental conditions.
· Segment cells and assign transcripts to individual cellular locations.
· Filter low-quality cells and normalize gene-expression measurements.
· Train machine-learning models to predict biological age from spatial gene-expression patterns.
· Calculate age acceleration or deviation from expected age for individual cell types.
· Measure proximity effects by comparing the molecular age of cells near a candidate effector cell type with cells farther away.
· Validate findings across regions, datasets, sexes or complementary single-cell technologies where possible.
· Use the model to compare interventions such as exercise or partial cellular reprogramming.
This framework is relevant beyond aging. The same combination of spatial omics and machine learning can be adapted to tumour microenvironments, immunotherapy response, tissue regeneration and inflammatory disease. For cancer research, a particularly attractive extension would be to combine spatial immune-cell mapping with molecular biomarkers and single-cell functional assays to determine why some immune-cell states support tumour control while others promote immune suppression.
7. Translational Integration for Precision Oncology
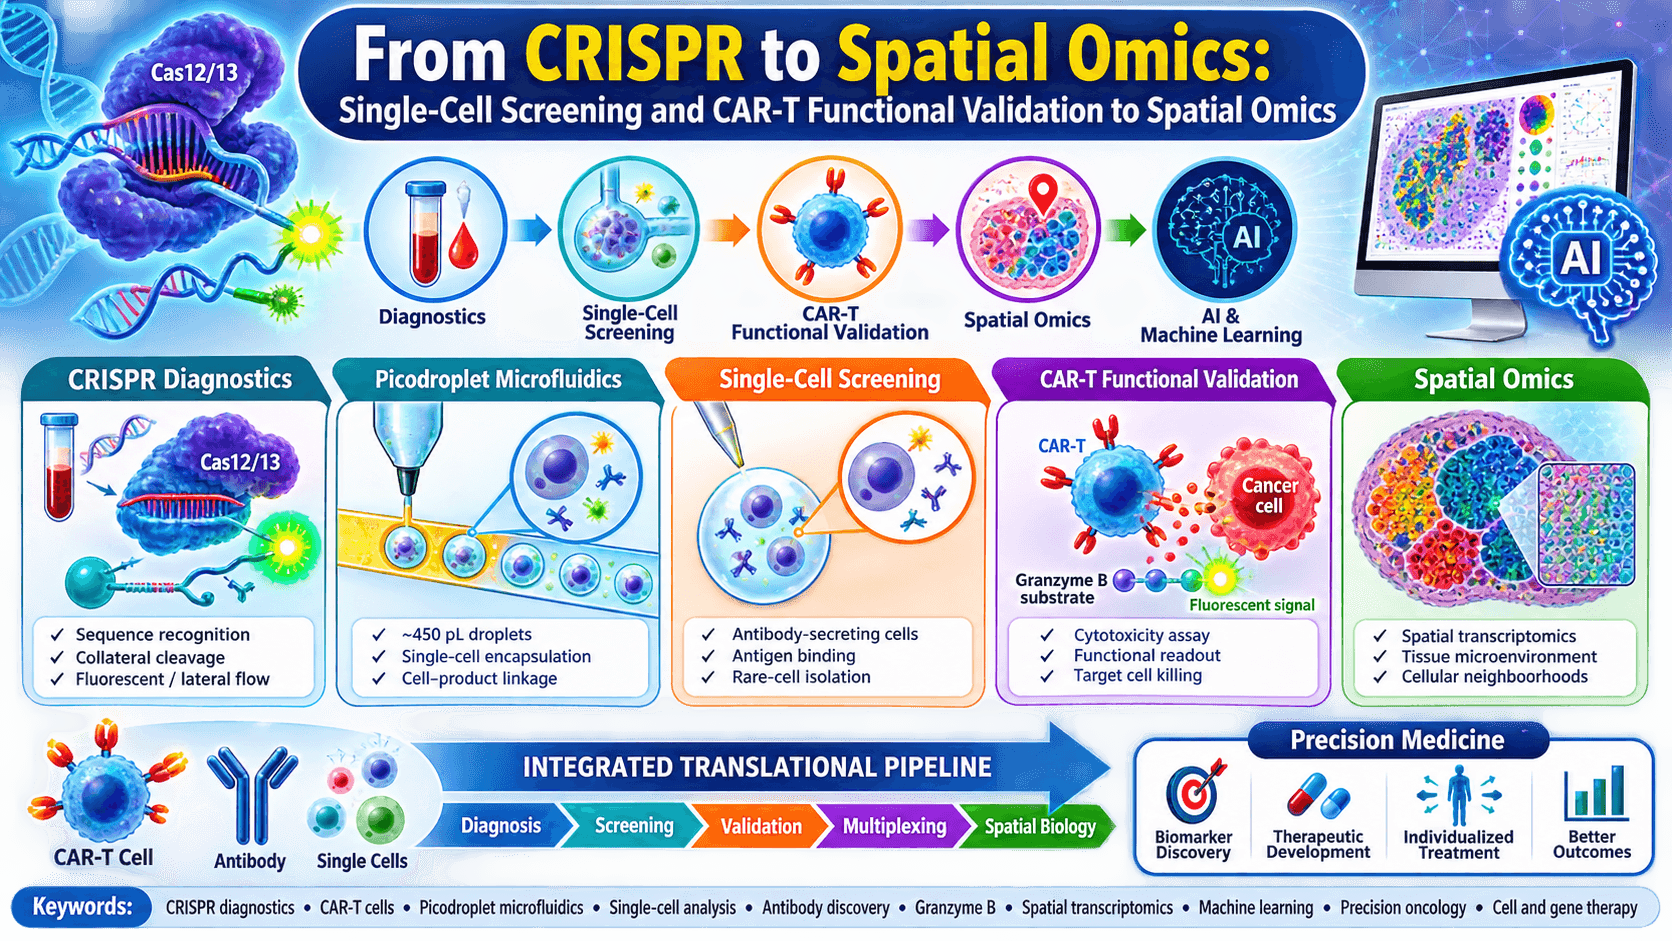
CRISPR diagnostics identify molecular signals; picodroplets identify rare cells and functional phenotypes; multiplexing adds resolution; and spatial transcriptomics explains tissue context. Together they create a multi-scale architecture from nucleic acids to cells and tissue.
A future precision-oncology workflow could therefore begin with molecular profiling of a tumour or liquid biopsy, followed by identification of candidate biomarkers and therapeutic targets. CRISPR-based assays could provide rapid targeted detection, while single-cell droplet platforms could screen antibody-producing or engineered-cell populations. Candidate CAR-T products could be evaluated using antigen-specific functional assays before more extensive characterization. Spatial transcriptomics could then be used to understand immune-cell localization, tumour-cell heterogeneity and the relationship between therapeutic cells and the tumour microenvironment. Machine learning could integrate these heterogeneous datasets to identify predictors of response.
For a cancer-focused research platform, the pipeline can be extended into a multi-omics CRISPR decision system. Public cancer datasets can first be mined to identify recurrent mutations, differentially expressed genes and candidate biomarkers. Candidate targets can then be evaluated for sequence conservation, tumour specificity and normal-tissue expression. CRISPR guide candidates are ranked for predicted activity and specificity, while transcript isoforms and patient-specific variants are incorporated into the selection process. Experimentally tested perturbations can be evaluated by sequencing and then integrated with RNA-seq, proteomics and spatial transcriptomics. Single-cell or picodroplet functional assays can provide an additional phenotype layer. The result is a closed-loop framework linking computational target discovery, CRISPR perturbation, single-cell function and spatial tumour biology.
8. Proposed application to a precision-cancer research platform
At minimum, quality control should be applied at six points: reference-sequence quality; guide/PAM compatibility; target conservation; off-target specificity; experimental controls; and sequencing-data quality. Diagnostic workflows should additionally include target-versus-non-target specificity, strain/variant coverage and reference-method comparison. Genome-editing workflows should consider both on-target and unintended genomic changes. Computational predictions should never be presented as experimental confirmation.
8.1 Quality-control checkpoints
A practical research workflow can combine NCBI/Ensembl or other authoritative reference resources for sequence and annotation retrieval; BLAST or k-mer approaches for sequence comparison; multiple-sequence alignment and pangenome analysis for conservation; CRISPRdirect, CHOPCHOP, GuideScan2 or comparable systems for guide design; Cas-OFFinder or related tools for off-target searches; CRISPResso2 for editing-outcome analysis; and R/Python for statistical analysis, visualization and reproducible reporting. Galaxy can provide a user-friendly environment for combining many bioinformatics steps, while workflow managers such as Nextflow or Snakemake can improve reproducibility for larger projects. Tool choice should be matched to the Cas enzyme, organism, application and validation requirements.
8.2 Recommended computational tool stack
The integrated pipeline has applications across several areas. (1) Cancer biomarker discovery: identify recurrent mutations or transcripts, design allele-specific guides or diagnostic guides, and integrate results with tumour multi-omics. (2) CRISPR-based cancer diagnostics: design guides against circulating tumour DNA or other nucleic-acid biomarkers and evaluate conservation and specificity computationally before laboratory testing. (3) CAR-T engineering: support selection or analysis of genes involved in antigen recognition, persistence, exhaustion and safety, followed by sequencing-based quality control. (4) Antibody and single-cell discovery: connect sorted cell phenotypes with sequence information and downstream functional validation. (5) Infectious-disease diagnostics: continuously update primer and guide designs as pathogen genomes evolve. (6) CRISPR screens: map guide-level effects to genes and pathways and identify candidate therapeutic targets. (7) Spatial precision oncology: integrate CRISPR perturbation data with single-cell and spatial transcriptomic profiles to determine how molecular perturbations influence cellular states and neighbourhoods.
8.3. Applications of the bioinformatics pipeline
The final bioinformatics layer connects the sequence-level result to biological function. Edited genes can be mapped to pathways, protein interactions and phenotypes using transcriptomic, proteomic or functional-screen data. In cancer research, this could connect CRISPR perturbations to pathways such as PI3K/AKT/mTOR, MAPK/ERK, Wnt/β-catenin, NF-κB or p53, followed by integration with single-cell or spatial transcriptomic data. This is particularly relevant to the review’s broader theme: CRISPR identifies or perturbs molecular targets, picodroplets measure individual-cell function, and spatial omics establishes the tissue context.
8.4. Functional interpretation and integration with multi-omics
For genome-editing experiments, sequencing reads are quality-controlled, aligned or otherwise mapped to the target region, and analyzed to quantify editing outcomes. CRISPResso2 is a widely used framework for processing and visualizing CRISPR genome-editing data, including quantification of sequence alterations at targeted loci. This stage allows researchers to distinguish the intended editing outcome from unexpected sequence changes and to compare experimental groups using consistent metrics. The need for rigorous analysis is underscored by evidence that CRISPR/Cas9 editing can generate not only small insertions and deletions but also larger deletions and genomic rearrangements. [24,25]
8.5. NGS analysis of CRISPR editing outcomes
After computational selection, candidates should be experimentally evaluated using the assay appropriate to the application. In genome editing, amplicon sequencing can determine the proportion of intended edits and characterize insertions, deletions and other sequence outcomes. In diagnostic development, analytical sensitivity, specificity, limit of detection, cross-reactivity and agreement with a reference method should be assessed. The computational pipeline should therefore be treated as an iterative system: experimental results feed back into guide ranking and assay optimization.
8.6. Experimental readout and sequencing
In CRISPR-Cas12a or Cas13 diagnostics, bioinformatics is used not only to design the guide but also to design the upstream amplification component when an amplification step is used. A practical computational workflow is: collect target and non-target sequences; perform quality control; identify conserved target regions; select primer candidates; identify compatible PAM/protospacer sites; rank guides by target prevalence and specificity; screen against non-target databases; and generate a final primer–guide combination for laboratory validation. PathoGD is a recent example of an automated pipeline implementing pangenome and k-mer-based strategies for primer and Cas12a gRNA design and continuous monitoring of sequence variation. [19]
8.7. CRISPR diagnostic branch: primer and guide co-design
A guide can appear specific against a reference genome but behave differently in a genetically diverse population. Therefore, clinically relevant variants, strain diversity and transcript isoforms should be considered. For therapeutic or diagnostic applications, the pipeline should flag guides that overlap common variants or that fail to recognize important alleles. Updated genome annotations should also be used when interpreting CRISPR-screen results because gene models and transcript boundaries can change over time.
8.8. Variant, isoform and annotation analysis
Every candidate guide should be evaluated against the relevant genome or metagenome to identify sequences with substantial similarity that could potentially be recognized by the Cas effector. Computational specificity analysis considers sequence mismatches, PAM compatibility and, depending on the tool, mismatch position and other sequence features. Tools such as Cas-OFFinder, CRISPRdirect and GuideScan-family approaches can support this stage. Recent GuideScan2 work provides genome-wide guide databases and specificity analysis for Cas9 and Cas12a, including custom genomes. [23] Off-target prediction should be complemented by experimental assessment because computational predictions cannot capture every biological outcome.
8.9. Off-target prediction and specificity analysis
Candidate guides should be ranked using predicted activity, sequence composition, target accessibility where applicable, isoform coverage and the intended biological outcome. CRISPRdirect and related design tools provide computational selection of candidate targets while considering off-target sites. Contemporary design systems increasingly incorporate machine-learning-derived activity scores and large guide libraries. Importantly, computational scores are prioritization tools, not proof of biological activity; experimental validation remains necessary. [21,22]
8.10. Guide RNA/crRNA design and on-target scoring
For genome editing, candidate protospacers are generated according to the recognition requirements of the selected Cas enzyme and its PAM. Cas9, Cas12a and other effectors differ in PAM requirements and guide architecture. Therefore, guide design should be performed against the correct Cas system rather than assuming that one design rule applies to all CRISPR enzymes. Current Cas12a research also emphasizes its distinctive target-recognition, cis-cleavage and trans-cleavage properties, which are particularly relevant to diagnostic applications. [20]
8.11. Identify PAMs and candidate protospacers
For CRISPR diagnostics, multiple target genomes can be aligned or compared to identify regions that are highly conserved within the intended target group but sufficiently divergent from non-target organisms. Pangenome and k-mer analyses can help quantify target prevalence and discriminate conserved target sequences from regions with excessive variation. The output is a ranked set of candidate diagnostic regions.
8.12. Identify conserved target regions
Reference sequences and annotations should be obtained from authoritative genomic resources and checked for assembly version, transcript isoforms, sequence completeness and relevant genetic variation. For diagnostic development, multiple genomes or assemblies from the target organism should be collected rather than relying on a single reference. This is important because a guide that is specific to one reference sequence may fail when circulating strains contain mutations in the protospacer or PAM. PathoGD illustrates this principle by combining comparative genomics, pangenome and k-mer approaches for high-throughput primer and Cas12a guide design. [19]
8.13. Retrieve and quality-control reference sequences
The first step is to define whether CRISPR-Cas will be used for genome editing, CRISPR interference/activation, nucleic-acid detection or another application. For genome editing, the target may be a coding exon, regulatory region, mutation or disease-associated allele. For diagnostics, the target may be a pathogen-specific sequence, resistance determinant, mutation or circulating tumour-DNA marker. The desired outcome determines the appropriate Cas effector, guide architecture, reference genome and validation strategy.
For the purposes of this review, the pipeline can be divided into two related branches. The first is a CRISPR-Cas genome-engineering branch, in which bioinformatics supports guide selection, on-target activity prediction, off-target analysis, experimental sequencing and editing-outcome quantification. The second is a CRISPR-diagnostic branch, in which comparative genomics identifies conserved diagnostic regions and computational tools design amplification primers and Cas12/Cas13 guide RNAs that maximize target coverage while minimizing cross-reactivity. The latter is particularly relevant to the CRISPR diagnostic section of the uploaded booklet.
Bioinformatics is a central component of modern CRISPR-Cas research because the biological performance of a CRISPR experiment depends on the quality of the reference sequence, target-site selection, guide design, specificity assessment and downstream interpretation. Reviews of CRISPR-Cas bioinformatics emphasize that computational analysis now spans discovery of CRISPR systems, guide design, off-target prediction and analysis of editing outcomes. Recent systematic work also highlights the need for more integrated pipelines because many existing tools address only one part of the workflow. [17,18]
9. Challenges, Quality Control and Ethical Considerations
Despite impressive capabilities, these methods require careful quality control. For CRISPR diagnostics, guide specificity, target conservation, amplification bias, contamination control, reporter stability and threshold selection are critical. For picodroplet assays, droplet occupancy, cell viability, emulsion stability, nonspecific fluorescence, cross-reactivity and sorting accuracy must be controlled. Functional CAR-T assays additionally require appropriate antigen-positive and antigen-negative controls and independent confirmation that fluorescence reflects biologically meaningful cytotoxicity. Multiplexed assays require rigorous spectral controls and gating strategies. Spatial transcriptomics requires attention to tissue quality, segmentation accuracy, transcript assignment, batch effects and model generalizability.
Clinical translation also requires reproducibility, validated reference methods, appropriate regulatory pathways, patient privacy and responsible interpretation of AI-derived predictions. A computational model that performs well in one dataset may fail when tissue composition, demographic characteristics or experimental platforms change. Similarly, a high-throughput screening platform can accelerate discovery but does not automatically establish clinical efficacy or safety. These technologies should therefore be viewed as components of a staged evidence-generation process rather than replacements for established clinical validation.
10. Conclusion
The uploaded Cell & Gene Therapy booklet provides a valuable overview of a rapidly converging scientific landscape. Its central methodological message is that precision medicine increasingly depends on technologies capable of measuring biology at high throughput without losing single-cell or spatial information. CRISPR diagnostics offer programmable molecular recognition; picodroplets create miniature environments for high-throughput single-cell screening; granzyme B assays provide a functional readout for CAR-T activity; multiplexing enables simultaneous phenotypic measurements; and spatial aging clocks demonstrate how machine learning can interpret cell-cell relationships within tissue. The strongest future opportunity lies not in any single technology but in their integration. A combined molecular, single-cell, functional and spatial framework could improve biomarker discovery, antibody development, cellular-product characterization and individualized cancer therapy. The ultimate goal should be translation: turning high-resolution biological measurements into reproducible, safe and clinically useful interventions that improve human health.
11. References
1. Albelda SM. CAR T cell therapy for patients with solid tumours: key lessons to learn and unlearn. Nature Reviews Clinical Oncology. 2024;21:47–66. DOI: https://doi.org/10.1038/s41571-023-00832-4
2. Peng L, Sferruzza G, Yang L, et al. CAR-T and CAR-NK as cellular cancer immunotherapy for solid tumors. Cellular & Molecular Immunology. 2024;21:1089–1108. DOI: https://doi.org/10.1038/s41423-024-01207-0
3. Kaminski MM, Abudayyeh OO, Gootenberg JS, Zhang F, Collins JJ. CRISPR-based diagnostics. Nature Biomedical Engineering. 2021;5:643–656. DOI: https://doi.org/10.1038/s41551-021-00760-7
4. Mustafa MI, Makhawi AM. SHERLOCK and DETECTR: CRISPR-Cas Systems as Potential Rapid Diagnostic Tools for Emerging Infectious Diseases. Journal of Clinical Microbiology. 2021;59:e00745-20. DOI: https://doi.org/10.1128/JCM.00745-20
5. Sun ED, Zhou OY, Hauptschein M, et al. Spatial transcriptomic clocks reveal cell proximity effects in brain ageing. Nature. 2025;638:160–171. DOI: https://doi.org/10.1038/s41586-024-08334-8
6. Broughton JP, Deng X, Yu G, et al. CRISPR-Cas12-based detection of SARS-CoV-2. Nature Biotechnology. 2020;38:870–874. DOI: https://doi.org/10.1038/s41587-020-0513-4
7. Siddiqui SM, Welch NL, Nguyen TG, et al. Bead-based approaches for increased sensitivity and multiplexing of CRISPR diagnostics. Nature Biomedical Engineering. 2026;10:939–951. DOI: https://doi.org/10.1038/s41551-025-01498-2
8. Shembekar N, Hu H, Eustace D, Merten CA. Single-Cell Droplet Microfluidic Screening for Antibodies Specifically Binding to Target Cells. Cell Reports. 2018;22:2206–2215. DOI: https://doi.org/10.1016/j.celrep.2018.01.071
9. Josephides D, Davoli S, Whitley W, et al. Cyto-Mine: An Integrated, Picodroplet System for High-Throughput Single-Cell Analysis, Sorting, Dispensing, and Monoclonality Assurance. SLAS Technology. 2020;25:177–189. DOI: https://doi.org/10.1177/2472630319892571
10. Brouzes E, Medkova M, Savenelli N, et al. Droplet microfluidic technology for single-cell high-throughput screening. Proceedings of the National Academy of Sciences. 2009;106:14195–14200. DOI: https://doi.org/10.1073/pnas.0903542106
11. Brudno JN, Kochenderfer JN. Current understanding and management of CAR T cell-associated toxicities. Nature Reviews Clinical Oncology. 2024;21:501–521. DOI: https://doi.org/10.1038/s41571-024-00903-0
12. Ghouneimy A, Mahas A, Marsic T, Aman R, Mahfouz M. CRISPR-Based Diagnostics: Challenges and Potential Solutions toward Point-of-Care Applications. ACS Synthetic Biology. 2023;12:1–16. DOI: https://doi.org/10.1021/acssynbio.2c00496
13. Hao L, et al. CRISPR-Cas-amplified urinary biomarkers for multiplexed and portable cancer diagnostics. Nature Nanotechnology. 2023;18:798–807. DOI: https://doi.org/10.1038/s41565-023-01372-9
14. Zuo X, Fan C, Chen HY. Biosensing: CRISPR-powered diagnostics. Nature Biomedical Engineering. 2017;1:0091. DOI: https://doi.org/10.1038/s41551-017-0091
15. Metz CHD, Schröder AK, Overbeck S, et al. T-helper type 1 cytokine release is enhanced by in vitro zinc supplementation due to increased natural killer cells. Nutrition. 2007;23:157–163. DOI: https://doi.org/10.1016/j.nut.2006.10.007
16. Lin PH, Sermersheim M, Li H, et al. Zinc in Wound Healing Modulation. Nutrients. 2017;10:16. DOI: https://doi.org/10.3390/nu10010016
17. Meier T, et al. CRISPR-Cas bioinformatics. Methods. 2019. DOI: https://doi.org/10.1016/j.ymeth.2019.07.013
18. Martinho do Bispo P, et al. CRISPR-Cas9 and Its Bioinformatics Tools: A Systematic Review. Cellular and Molecular Biology. 2025. DOI: https://doi.org/10.3390/cimb47050307
19. Low SJ, O’Neill M, Kerry WJ, et al. PathoGD: an integrative genomics approach to primer and guide RNA design for CRISPR-based diagnostics. Communications Biology. 2025. DOI: https://doi.org/10.1038/s42003-025-07591-1
20. Saha A, Fregoso Ocampo R, Wright JT, et al. Molecular mechanisms and biotechnology applications of CRISPR–Cas12a. Nature Reviews Molecular Cell Biology. 2026;27:601–616. DOI: https://doi.org/10.1038/s41580-026-00969-x
21. Naito Y, Hino K, Bono H, Ui-Tei K. CRISPRdirect: software for designing CRISPR/Cas guide RNA with reduced off-target sites. Bioinformatics. 2015;31:1120–1123. DOI: https://doi.org/10.1093/bioinformatics/btu743
22. Doench JG, et al. CRISPR guide RNA design for research applications. FEBS Journal. 2016. DOI: https://doi.org/10.1111/febs.13777
23. Schmidt H, et al. Genome-wide CRISPR guide RNA design and specificity analysis with GuideScan2. Genome Biology. 2025. DOI: https://doi.org/10.1186/s13059-025-03517-0
24. Clement K, Rees H, Canver MC, et al. CRISPResso2 provides accurate and rapid genome editing sequence analysis. Nature Biotechnology. 2019;37:224–226. DOI: https://doi.org/10.1038/s41587-019-0032-3
25. Kosicki M, Tomberg K, Bradley A. Repair of double-strand breaks induced by CRISPR-Cas9 leads to large deletions and complex rearrangements. Nature Biotechnology. 2018;36:765–771. DOI: https://doi.org/10.1038/nbt.4192.
26. Rodrigues KB, Eggenhuizen PJ, Bacchetta R, Good Z. Regulatory T cell therapies: from patient data to biological insights.Frontiers in Immunology. 2025;16:1675114. DOI:10.3389/fimmu.2025.1675114.
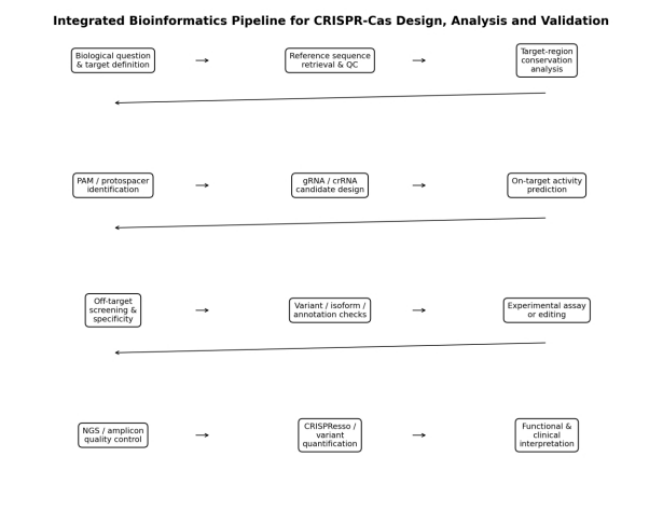
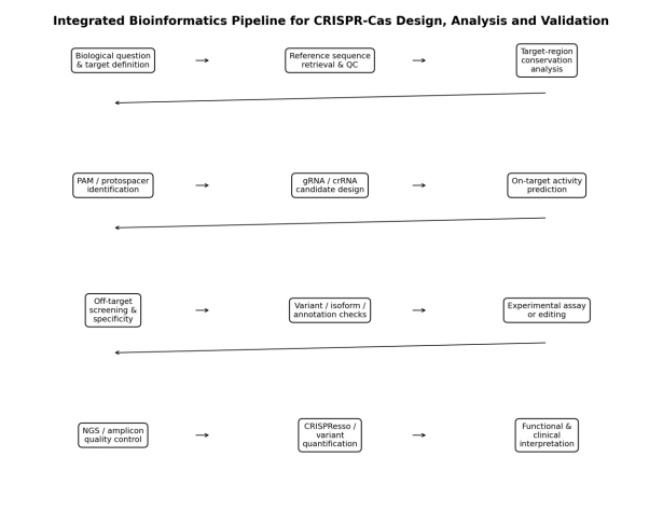
Figure 2: Workflow depicting high-throughput CAR-T cell function verification in microfluidic picodroplets.
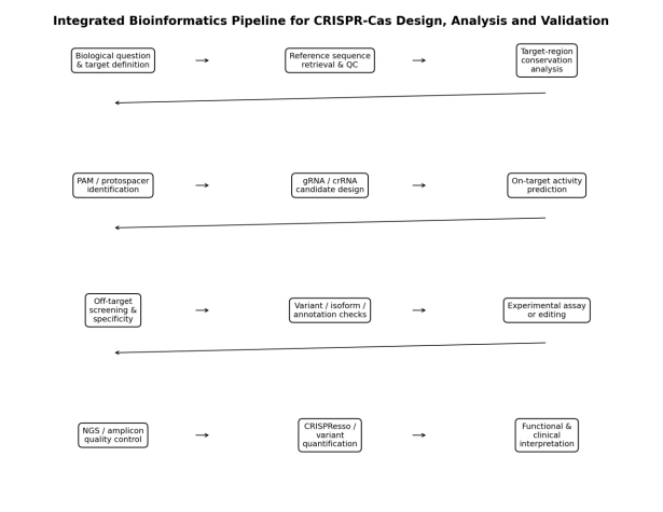
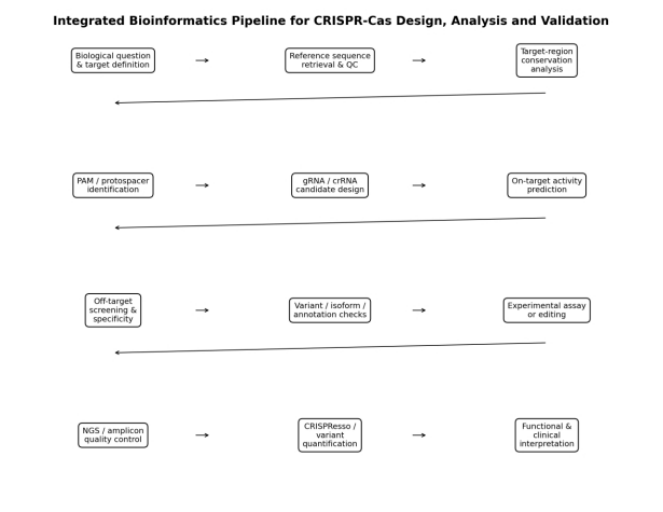
Figure 4. Schematic Workflow for the Development and Preclinical Validation of Placental Chondroitin Sulfate (pCS)-Targeted CAR-T Cells.
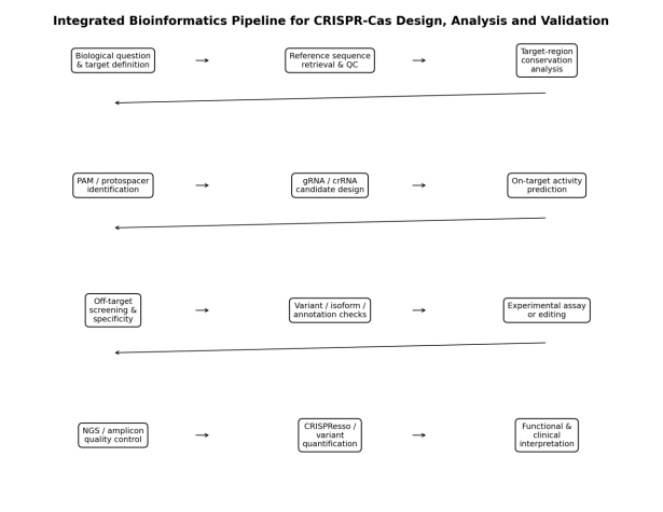
Figure 5. Conceptual illustration of brain aging, highlighting age-associated cognitive decline and structural and cellular changes within the brain. The illustration provides a visual representation of the complex biological processes associated with aging and the importance of investigating cellular interactions and spatial organization in the aging brain. Spatial aging clocks linking spatial transcriptomics, cell neighbourhoods and aging.
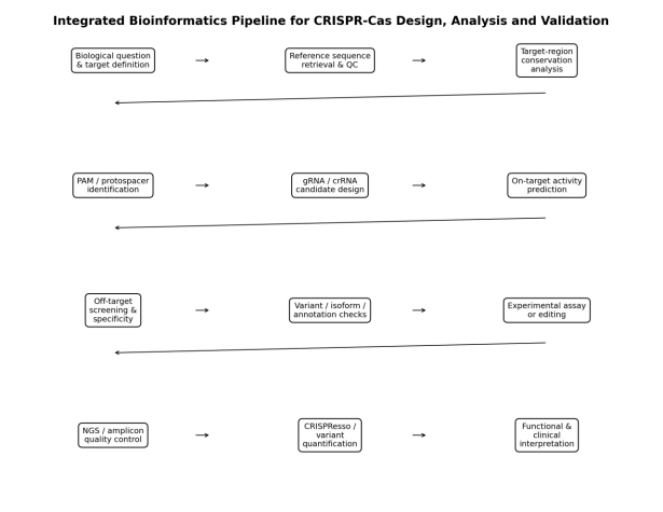
Figure 6. Integrated bioinformatics pipeline for CRISPR-Cas design, diagnostics and validation.
Course details
Lectures
4Level
BEGINNEREnrollment
Self EnrollmentInstitution
Emma Insight Start-Up India